Think of your Twitter account analytics as the story your content is telling you. It's not just a jumble of numbers; it's a direct conversation with your audience, showing you what they love, what they share, and what they scroll right past.
Your Guide to Understanding Twitter Performance
Just like a pilot needs a dashboard to fly a plane, you need analytics to steer your account. It's the only way to stop guessing what works and start knowing what actually drives growth. This guide will help you translate those metrics into real, meaningful actions.
It’s all about listening to your data so you can sharpen your strategy and build a community that genuinely cares about what you have to say.
From Guesswork to Growth
The first real step is to look beyond simple vanity metrics, like your follower count. Real performance is measured by how your content actually gets people to act. You need to understand the why behind the numbers—why one post took off while another one flopped. For a deeper dive into tracking your impact, start by monitoring your Twitter presence. This data-first approach is what lets you create content that hits the mark, time and time again.
Key Takeaway: Solid Twitter analytics isn't about staring at charts. It's about turning numbers into a smarter, more responsive content plan. This is the feedback loop you need to stop guessing and start growing with purpose.
With 561 million active users around the world, the potential to reach people is staggering, but that also makes it harder to cut through the noise. This is where analytics becomes your secret weapon. For example, since men make up 63.7% of the user base, brands targeting them have a huge opportunity. Add to that a 35% year-over-year jump in global ad engagement, and you can see why marketers are paying attention.
Some accounts have even seen 15-25% monthly follower increases just by posting consistently and paying attention to trends. You can find more of these kinds of insights in this 2024 report on Twitter usage.
The built-in X Analytics dashboard gives you a quick 28-day summary of how you're doing.
This little snapshot shows you the essentials—Tweet impressions, profile visits, and new followers—so you can spot recent trends at a glance. We're going to cover how you can use both the native tools and more advanced third-party platforms to listen, refine, and grow.
Getting to Grips with the Core Analytics Metrics
To get anything meaningful out of your Twitter analytics, you need to learn how to read the signs. The numbers in your dashboard are more than just data points; they're direct feedback from your audience, telling you what they love, what they ignore, and what they want to see more of. It's about looking past the definitions and understanding the human behavior behind the stats.
Think of Impressions as the digital equivalent of foot traffic. It's not about how many unique individuals saw your post, but the total number of times it was displayed on a screen. A big impression number is a good start—it means your content is getting out there—but it's only one part of the puzzle.
That’s where your Engagement Rate becomes your most valuable ally. This metric is the heartbeat of your account, measuring the percentage of people who actually stopped to interact with your post—be it a like, reply, repost, or a click. A high engagement rate is the ultimate signal that your content didn't just appear on a screen, but genuinely connected with someone.
What Key Performance Indicators (KPIs) Actually Tell You
To build a full picture, you need to look at a few core metrics in tandem. Each one gives you a different clue about what’s working, revealing specific user actions that can sharpen your content strategy.
- Profile Visits: This tells you how many people saw one of your posts and thought, "I want to know more about this person/brand." It's a fantastic indicator of genuine interest.
- Mentions: This is your real-time brand monitoring feed. Keeping an eye on mentions shows you who’s talking about you and why, offering priceless insights into the conversations surrounding your account.
- Follower Growth: A straightforward but vital stat. Are you gaining more followers than you're losing? Steady, consistent growth is a clear sign your overall strategy is hitting the mark.
- Link Clicks: If your goal is to drive traffic, this is your bottom line. It directly measures how many people followed your call-to-action and clicked a URL, showing how effective your posts are at getting people to take the next step.
The real magic happens when you connect these dots. Seeing tons of impressions but hardly any link clicks? Your headline probably grabbed attention, but your offer or call-to-action didn't seal the deal. Noticing a big jump in profile visits after a specific post? That's a huge hint that the topic is a powerful magnet for attracting new followers.
Analytics isn't a one-and-done task. It's a continuous feedback loop: you listen to the data, refine your approach based on what you learn, and watch your account grow as a result.
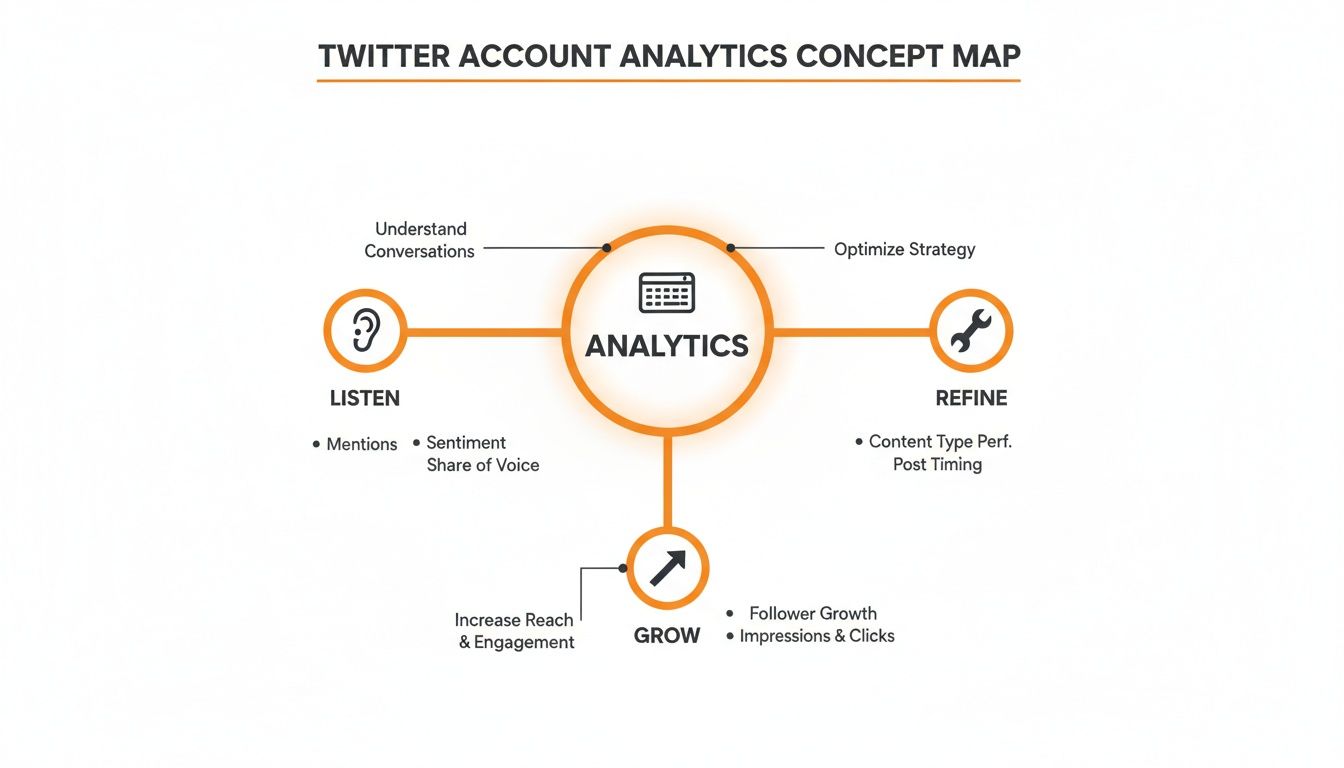
As you can see, this cycle keeps you tuned in to what your audience wants, helping you make smarter decisions every step of the way.
A Quick Guide to Core Metrics
To make this even clearer, here's a quick-reference table breaking down the most important metrics you'll find in your analytics dashboard.
| Key Twitter Analytics Metrics and Their Meaning | | :--- | :--- | :--- | | Metric | What It Measures | Why It's Important | | Impressions | The total number of times a post was shown to users. | Measures the overall reach and visibility of your content. | | Engagement Rate | The percentage of impressions that resulted in an interaction (like, reply, click, etc.). | Shows how compelling and relevant your content is to your audience. | | Follower Growth | The net change in your total number of followers over a specific period. | Indicates the health and appeal of your account and content strategy. | | Profile Visits | The number of times users visited your main profile page. | Signals strong interest in your brand or persona beyond a single post. | | Link Clicks (CTR) | The number of clicks on a URL included in your post. | Directly measures how effective your content is at driving off-platform traffic. | | Mentions | The number of times your @handle was used by other accounts. | Provides insight into brand conversation, reputation, and social listening. |
Think of this table as your cheat sheet for translating raw numbers into actionable insights.
A Note on Calculating Your Engagement Rate
While X Analytics shows you an engagement rate, it’s helpful to know how it's calculated. The formula is simply your total engagements (likes, replies, reposts, and clicks) divided by your total impressions.
Understanding this simple equation puts you in the driver's seat. For a more detailed breakdown, check out this guide on how to calculate your Twitter engagement rate. Knowing the math helps you set realistic benchmarks and track your progress with much more confidence.
How to Access and Navigate Your Analytics Dashboard
Alright, you know what the key metrics are. Now it's time to get your hands dirty and see them in action. Accessing your Twitter account analytics is the first real step in turning those abstract numbers into a solid, workable strategy. Luckily, X makes it pretty simple to get started.
Think of the native dashboard as your mission control. It's the central hub where you can get a bird's-eye view of your performance or zoom way in to see how a single post performed.
Getting there is easy—just head over to analytics.twitter.com while you’re logged into your account. X gives access to both personal and business profiles automatically, so there's no complicated setup to worry about. The second you land on the homepage, you’re looking at a live report card on your account’s health.
Your Account Home: The 28-Day Snapshot
The first thing you’ll lay eyes on is the Account Home. This page serves up a 28-day summary of your activity, and it’s designed to give you a quick pulse check without drowning you in data.
It puts your most important metrics front and center:
- Tweet impressions: The total number of times your posts were seen.
- Profile visits: How many people were curious enough to click on your profile.
- Mentions: The number of times other users tagged your @handle.
- Followers: Your current follower count and how it’s changed over the last month.
This dashboard also calls out your "Top Tweet," "Top Mention," and "Top Follower," which gives you an immediate clue about what’s hitting the mark. It's the perfect starting point for a weekly review, since it instantly flags any major wins or worrying dips.
Key Insight: The Account Home isn’t for deep, granular analysis. It’s for pattern recognition. Use it to quickly spot if your recent content strategy is actually moving the needle in the right direction.
The Tweet Activity Dashboard: A Deeper Dive
When you need to get more specific, the Tweet Activity dashboard is where you'll want to spend your time. This is where you can break down the performance of every single tweet, looking at detailed impression and engagement numbers for each one. You can even export all this data as a CSV file if you want to slice and dice it in a spreadsheet.
This is the place where you can directly connect your content choices to real results. For instance, you could compare the engagement rate of a video post against a text-only update or see firsthand how different hashtags changed your impression count.
Many third-party tools pull this kind of data through what's called an API. If you're curious about the tech behind it all, our guide on the essentials of the social media API is a great place to start.
Finally, for anyone focused on video, the Video Activity tab provides tailored insights. It tracks crucial metrics like view rates and completion rates, showing you not just how many people started watching, but how many actually stuck around to the end. Getting comfortable with these three core areas will give you a powerful foundation for building a smarter, data-driven X strategy.
Turning Raw Data Into an Actionable Strategy
Having access to your Twitter account analytics is one thing. Knowing what to do with that data is where the real growth happens. Think of raw data as a box of puzzle pieces—interesting on their own, but the true value emerges when you start connecting them to see the bigger picture. This is how you stop just reporting numbers and start building a real strategy.
The first step is a mental shift: stop obsessing over individual posts and start looking for patterns across all your content. Don't just celebrate a "Top Tweet." Ask why it was your top tweet. Was it the topic? The format (video, thread, poll)? The time of day? The specific question you asked? Uncovering these patterns is how you build a winning formula you can use again and again.
Identifying Your Content Pillars
Your analytics dashboard is a goldmine for discovering what your audience actually cares about. Take a look at your best-performing posts from the last month or so and start grouping them by topic. You might find that posts sharing behind-the-scenes content get double the engagement of your perfectly polished promotional tweets.
For instance, a graphic design agency might notice their posts breaking down color theory consistently outperform their project showcases. That doesn't mean they should stop showing off their work. It just means color theory is a powerful "content pillar"—a theme that grabs and holds the attention of their ideal audience.
By identifying two or three of these core themes, you can build a content calendar that you know will resonate. It takes the guesswork out of planning and makes your efforts far more effective.
Your best-performing content isn't a fluke; it's a clue. Your audience is telling you exactly what they want to see more of. Your job is to listen to the data and give them more of what works.
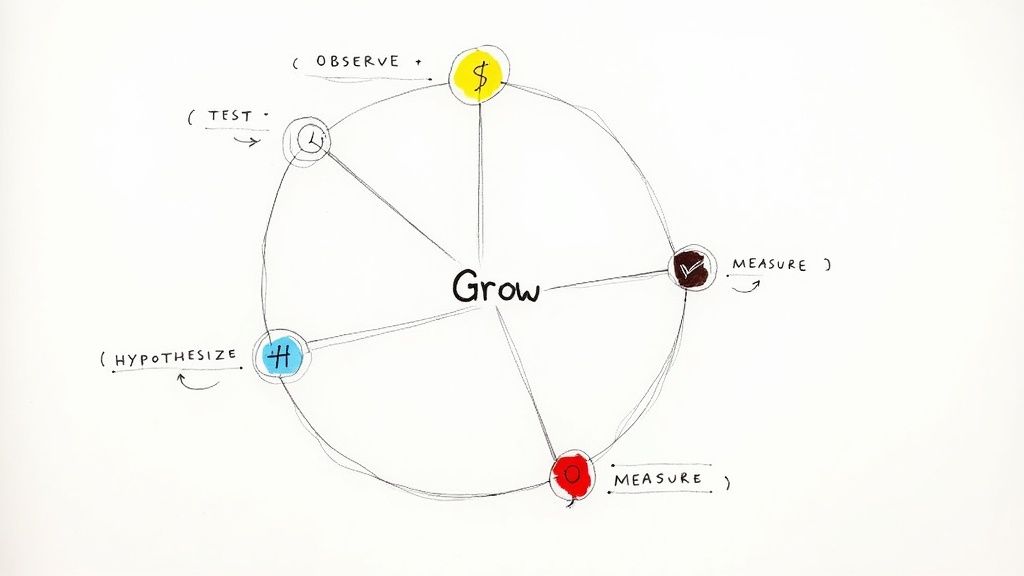
The Observe-Hypothesize-Test Framework
To turn these observations into a reliable growth engine, you can use a simple but incredibly powerful framework. This cycle ensures you're constantly learning from your analytics and fine-tuning your approach based on what's actually working.
Here’s the breakdown:
- Observe: Start by spotting a trend in your data. Maybe you notice your engagement rate consistently spikes between 8 AM and 10 AM on weekdays.
- Hypothesize: Form a clear, testable theory to explain it. "My audience seems to be most active during their morning commute, so posts during this window will probably perform better."
- Test: Create new content designed specifically to test that idea. Schedule a week's worth of your best stuff to go live at 9 AM and compare its performance to posts you publish at other times.
- Measure: Head back to your analytics. Did the 9 AM posts do as well as you hoped? Did your overall engagement rate for the week go up? Use these results to sharpen your understanding and kick off the cycle all over again.
This constant loop transforms your analytics from a backward-looking report card into a forward-looking roadmap. It helps you zero in on the best times to post, truly understand your audience's tastes, and make every piece of content you create more strategic than the last.
Using Analytics to Optimize Your Content
Once you get the hang of what the numbers in your dashboard mean, it’s time to put them to work. Effective twitter account analytics isn't about just watching the data roll in. It's about building a feedback loop where every metric gives you a clue about what to do next.
Think of it this way: if your link clicks are consistently low, it’s a sign your audience might not know what you want them to do. That's your cue to experiment with stronger calls-to-action (CTAs). Ditch the vague "learn more" and try something direct like, "Read the full case study here" or "Grab your free template now."
What if your posts get tons of likes and replies, but your follower count isn't budging? This tells you people like what you're saying, but they aren't convinced they need to stick around. That’s an opportunity to tighten up your profile bio or end your best threads with a simple prompt inviting people to follow for more.
Replicating Your Successes
Your best-performing posts are more than just wins to celebrate—they're a blueprint. Dig into the analytics for your "Top Tweets" and break down exactly what made them tick. Don't just glance at the topic; analyze every little detail.
- Format: Was it a multi-post thread, a single image with text, a poll, or a video?
- Tone: Did you use a humorous, educational, or inspirational voice?
- Structure: Did it grab attention with a sharp question or a surprising statistic right at the start?
When you spot these common threads, you can start building templates or content formulas based on what’s already proven to work. This is how you shift from random viral hits to a repeatable system for creating content you know your audience wants. You're moving from guesswork to strategy.
Key Insight: Treat your analytics dashboard like a 24/7 focus group. Every like, reply, and click is a vote for a certain type of content. Your job is to count the votes and make more of what’s winning.
Refining Your Hashtag and Media Strategy
Hashtags and media can give your content a serious boost, but only if you approach them with data. Your analytics will show you which hashtags are actually driving impressions and which ones are just taking up character space. If a few tags keep showing up on your top posts, they should become a core part of your strategy.
Video analytics give you an even clearer picture. Don't just focus on the view count; look at the video completion rate. If everyone is dropping off in the first three seconds, your hooks aren't working. On the other hand, a high completion rate is a massive signal that your format and storytelling are on point, and you should definitely do more of that.
The same idea applies to your posting schedule. While general guides on the best time to post on Twitter are a good starting point, your own data holds the real answers. Check your Tweet Activity to see if posts published at certain times always get better engagement. If so, adjust your schedule to match when your audience is most active. This constant cycle of testing and tweaking is what a real data-driven strategy is all about.
Got Questions About Twitter Analytics? We've Got Answers.
Jumping into your Twitter account analytics for the first time can feel a little like trying to read a foreign language. Once you start trying to connect the dots between the data and your actual strategy, a few questions almost always come up. Let's clear the air and tackle some of the most common ones so you can use your data with confidence.
Think of this as your go-to FAQ for those nagging "what if" and "why is this happening" moments. By getting these points sorted out, you can get back to what matters: refining your content and getting better results.
How Often Should I Actually Check My Analytics?
Finding the right cadence for checking your stats is all about staying on top of things without getting bogged down. For most people, a weekly check-in is the perfect middle ground. It's frequent enough to catch new trends and see what’s working, but not so often that you’re overanalyzing tiny daily bumps.
You'll also want to block out time for a deeper monthly review. This is where you zoom out, measure your progress against your bigger goals, and make any necessary strategic shifts. Daily checks? I’d only recommend those if you're in the middle of a high-stakes, time-sensitive campaign where you need immediate feedback to make quick adjustments.
Why Are My Impressions High but My Engagement Is So Low?
Ah, the classic analytics puzzle. If you're seeing tons of impressions but crickets on the engagement front, it means your content is getting out there—it's appearing on people's timelines—but it just isn't compelling enough to make them stop scrolling and interact.
It’s a clear signal that your hook isn't sharp enough. The culprit is usually one of a few things:
- Weak headlines that don’t spark any curiosity.
- Boring visuals that just blend into the feed.
- No clear question or call-to-action to give people a reason to respond.
Go back and look at the specific tweets where this is happening. Do you see a pattern? Start experimenting with different creative approaches, punchier opening lines, or more direct questions to finally earn that click, reply, or Retweet.
Can I See the Analytics for Other People's Accounts?
Nope, you can't peek into another user's private, native Twitter Analytics dashboard. That data is completely confidential and only available to the account owner.
But this is exactly where third-party analytics tools come in handy. Many platforms are designed to pull public data and estimate performance for any public profile. These tools are fantastic for competitive analysis. You can benchmark your own performance, see what’s working for others in your space, and uncover content ideas you might have overlooked.
By looking at the public metrics of your competitors, you can get a feel for industry-standard engagement rates and identify the kinds of content themes that really connect with your shared audience. It gives you a strategic leg up, all without seeing anyone's private data.
What's the Real Difference Between Impressions and Reach?
People often use these two terms as if they mean the same thing, but they measure two very different things. The main metric you'll see on Twitter/X is impressions, which is simply the total number of times a tweet was shown on a screen. If a single person sees your tweet on their timeline three different times, that counts as three impressions.
Reach, on the other hand, is a term you'll see more often on platforms like Facebook and Instagram. It measures the number of unique people who saw your content. So, on X, the focus is really on total views (impressions), not necessarily unique viewers (reach), giving you a sense of your content's overall visibility and how frequently it's being seen.
Ready to stop guessing and start growing with a smarter workflow? MicroPoster offers a premium suite of tools designed for serious creators on X. With our advanced editor, cross-platform publishing, and intelligent scheduling, you can turn your analytic insights into a powerful, consistent content strategy. Start your free trial and publish with purpose.